Growth Model Design project | Catawiki
Problem statement:
Increase Catawiki's Revenue from $400M to $3.2Billion (8x) in 12 months
Step 1: Define NSM and leading metrics
Catawiki appears to be in the mature scaling stage. The company has established itself as a prominent online auction platform, specializing in unique and collectible items such as art, jewelry, and classic cars. It has a significant user base and hosts numerous auctions weekly. Additionally, Catawiki continues to update its technology and expand its offerings, which is indicative of a company that is beyond the early stages of scaling and is focusing on optimizing and expanding its market presence.
Given that the company already achieved early scaling without breaking PMF, the North star metric would be Revenue while the leading metrics would be
- % Revenue retention
- # of transactions
- Frequency of transactions
- # Average order value
- #CAC to LTC ratio
Step 2: Building growth equation
Revenue = Total orders * AOV
Let us break this down further


Step 3: Product metrics & assumptions
Total monthly visits = 15.4 M
total unique visitors = 10M
Desktop visits = 36.81%
Mobile visits = 63.19%
Visit to signup rate = 53%
Pages per visit = 7.52
ARPU (yearly) = GMV/total users = 400M/(total unique visitors*signup rate*purchase rate) = $800
Avg session length = 5 mins
signup to purchase rate = 10%
AOV = $ 370
Number of yearly transactions = GMV/AOV = $1 M (monthly 83k transactions)
Retention rate- M3/M6/M12/M18/M24 = 30%
Definition of users:
Core users:
- Engage regularly but not as frequently as power users.
- They might participate in auctions and make purchases consistently but not as intensively.
- they might be active on the platform a few times a week
Casual users:
- Engage infrequently, often driven by specific needs or interests.
- They might browse or participate in auctions occasionally, such as once or twice a month.
- Casual users are those who access the platform less frequently and typically look for specific items.
Power users:
- These users are often the most valuable, providing regular feedback and influencing other users.
- They participate in multiple auctions, make frequent purchases, and are often early adopters of new features or services.
Activation metric definition: Placing a successful bid with a week of sign up
Retention metric definition: The percentage of buyers who return to make additional purchases on Catawiki after their initial transaction.
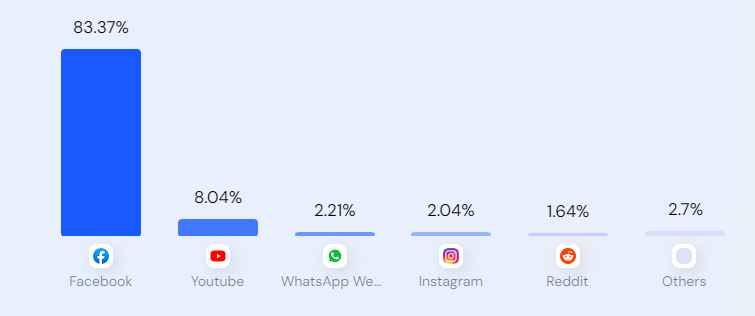
Top traffic source:

Social media traffic
Step 4: Nuke scenario- what happens if Catawiki doesn't acquire new customers for 12 months
If Catawiki doesn't acquire any new users, the total user base by M12 from retention and resurrection would be 3.02M
Growth Model - Catawiki - Google Sheets
Revenue (GMV) in nuke scenario = ARPU * total users in nuke scenario
= $40 * 3.02 M
= 120 M
Step 5: Revised Goal
Increase Catawiki's Revenue from $120M to $3.2 Billion in 12 months
Delta to be closed - $3.08 billion
Step 6: Calculate incremental growth
Incremental growth calculations -
Growth Model - Catawiki - Google Sheets
Step 7: Identify core levers
To close goal delta of $3.08 Billion, The core levers are
- Engagement (This would bring in additional $2.75 Billion)
- Onboarding (This would bring in additional $400 Million)
Conclusion:
Our revenue goal is $3 billion. Our current casual, core, and power users' percentages are 50%,30%, and 20% respectively. We need to increase proportion of core and power users by 5% each and double their transaction frequency to achieve 90% of our revenue goal.
Supporting arguments:
- Current user distribution - casual 50%, Core 30% , and power 20%
- Target user distribution - casual 40%, core 35%, and power 25%
- Current frequency monthly - casual 1, core 3, and power 4
- Target frequency monthly - casual 2, core 4, and power 6
- Incremental transactions achieved - 7.5 M
- AOV - $370
- Incremental revenue achieved due to incremental transactions- $ 2.77 Billion
- Current onboarding rate - 10%, Target onboarding rate - 20%
- ARPU yearly- $800
- Incremental impact revenue due to increased onboarding rate - $400 Million
Brand focused courses
Great brands aren't built on clicks. They're built on trust. Craft narratives that resonate, campaigns that stand out, and brands that last.


All courses
Master every lever of growth — from acquisition to retention, data to events. Pick a course, go deep, and apply it to your business right away.


Explore courses by GrowthX
Built by Leaders From Amazon, CRED, Zepto, Hindustan Unilever, Flipkart, paytm & more
Course
Advanced Growth Strategy
Core principles to distribution, user onboarding, retention & monetisation.
58 modules
21 hours
Course
Go to Market
Learn to implement lean, balanced & all out GTM strategies while getting stakeholder buy-in.
17 modules
1 hour
Course
Brand Led Growth
Design your brand wedge & implement it across every customer touchpoint.
15 modules
2 hours
Course
Event Led Growth
Design an end to end strategy to create events that drive revenue growth.
48 modules
1 hour
Course
Growth Model Design
Learn how to break down your North Star metric into actionable input levers and prioritise them.
9 modules
1 hour
Course
Building Growth Teams
Learn how to design your team blueprint, attract, hire & retain great talent
24 modules
1 hour
Course
Data Led Growth
Learn the science of RCA & experimentation design to drive real revenue impact.
12 modules
2 hours
Course
Email marketing
Learn how to set up email as a channel and build the 0 → 1 strategy for email marketing
12 modules
1 hour
Course
Partnership Led Growth
Design product integrations & channel partnerships to drive revenue impact.
27 modules
1 hour
Course
Tech for Growth
Learn to ship better products with engineering & take informed trade-offs.
14 modules
2 hours
Crack a new job or a promotion with ELEVATE
Designed for mid-senior & leadership roles across growth, product, marketing, strategy & business


Learning Resources
Browse 500+ case studies, articles & resources the learning resources that you won't find on the internet.

Patience—you’re about to be impressed.